Home
Explore What GeoCables can do Cables Locations Map My path ISP status Country resilience Check my connection
Live Network radar Live Map Cable monitoring Events log Cable incidents Big screen
Learn Research Guide Methodology Latency Overland links Deployments by year Pulse Open dataset API Widgets What's new About Contact

What GeoCables can do

GeoCables measures the internet itself: our own network polls 13,800 addresses in 235 countries around the clock, runs probes and traceroutes from our own points, and lets you measure from your browser. Below is everything the site can do for you, grouped by the question you came with.

My internet is gone. What is happening and when will it be back?

Is the internet down in a country?

Is the internet down in a country?

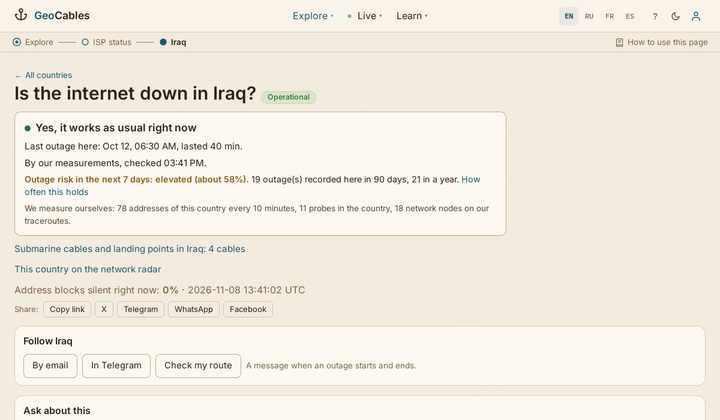
Every country page starts with the answer: yes, it works as usual, or no, there is an outage since this time. Under it: how long similar outages lasted, the risk for the next 7 days, what witnesses on the ground report, leading providers and the submarine cables that feed the country. 235 countries, in real time.

Iraq example
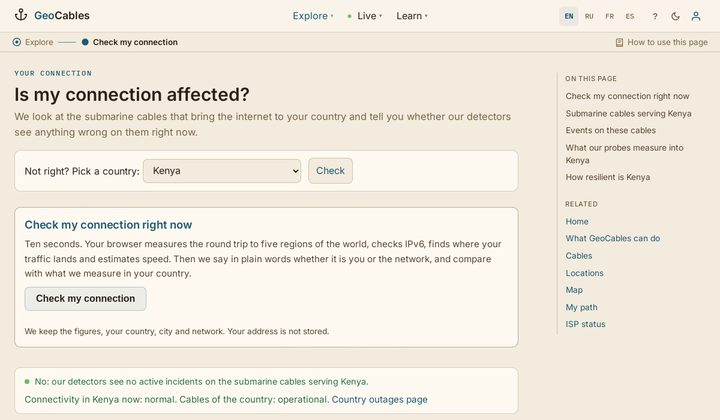
Is it me or the network?

Is it me or the network?

Press one button and your browser measures the round trip to five regions of the world, IPv6, where your traffic lands and speed, in ten seconds. The answer is in words: normal, slower than usual or bad, and whether it is your side or the network. Your result becomes a witness for your country; your address is not stored.

Check my connection
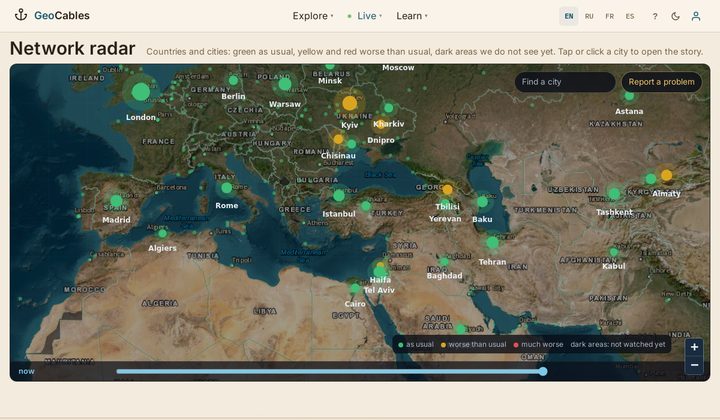
Network radar: cities, districts, what residents write

Network radar: cities, districts, what residents write

A map of countries and cities: green as usual, yellow and red worse than usual. Click a city to see its districts, our measurements and live phrases from residents about connectivity and power.

Open the radar
One chronology of everything

One chronology of everything

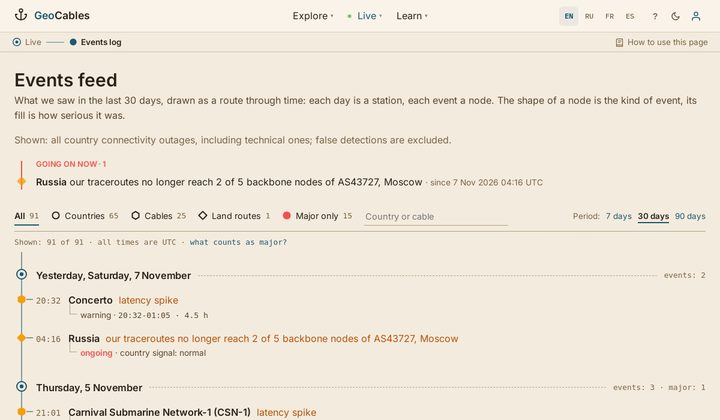
Country outages, cable incidents and land route events in one feed, newest first, with a daily internet weather summary.

Events feed

Where does my request go, and what breaks if a cable is cut?

The path of your request over submarine cables

The path of your request over submarine cables

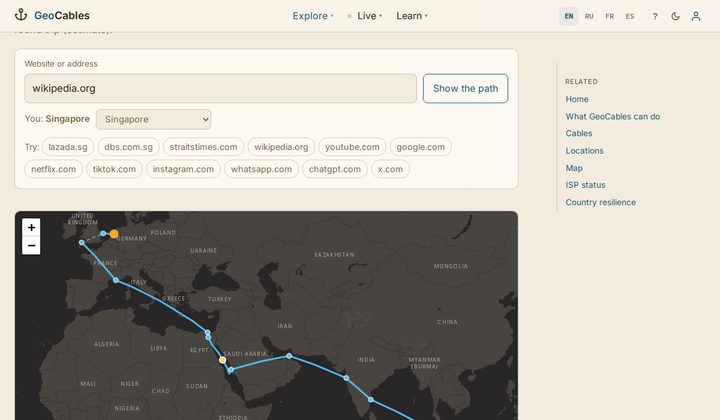
Type a website and watch your request run across the ocean floor: landing stations, cables, kilometres under the sea, milliseconds, share of the speed of light, and what happens to the path if any cable on it breaks. Built from our measurements and our graph of 728 cables.

Show my path
Cable passport and "if it breaks"

Cable passport and "if it breaks"

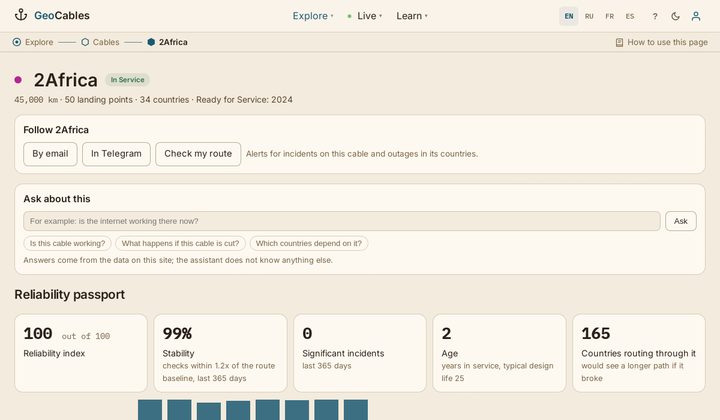
Each cable page: route, landing stations, owners, live latency across the cable against its 7-day norm, incidents, a 0-100 index, and which countries lose a path or gain latency if this cable is cut.

2Africa example
Country hub: cables, stations, vital cables

Country hub: cables, stations, vital cables

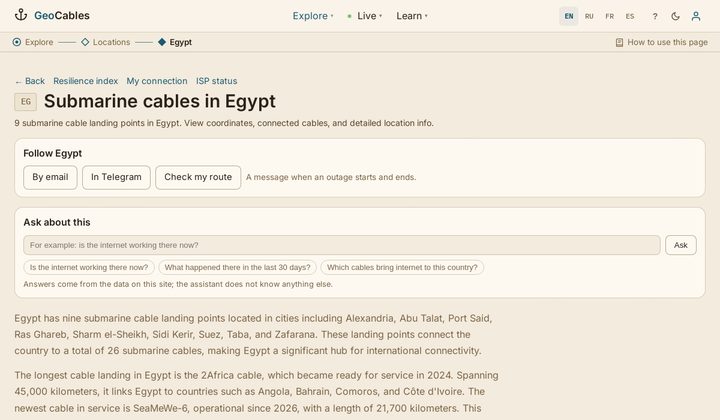
How a country is connected by sea: landing stations, cables, resilience index 0-100, the cables whose loss would hurt most, recent incidents and a link to the outage status.

Egypt example
Cable incidents with vessels nearby

Cable incidents with vessels nearby

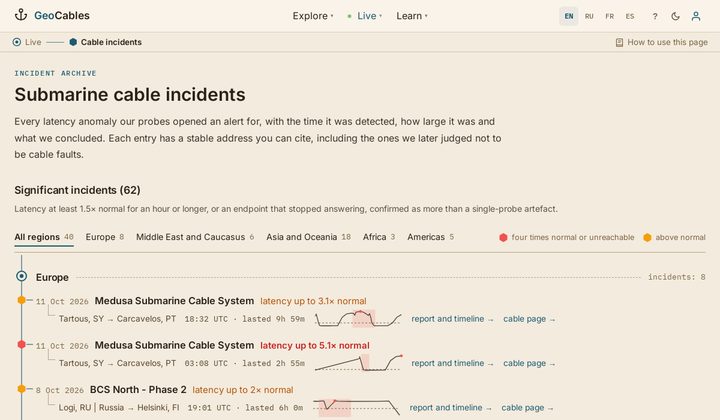
Every latency incident on a cable: when it started, how long it lasted, how far latency rose above the norm, and the vessels seen within 5 km of the route in the hours around it.

Incidents

Can I trust the numbers?

Every estimate has a public check

Every estimate has a public check

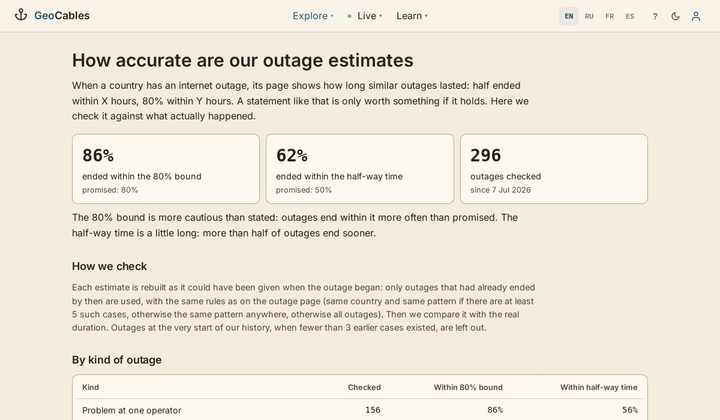
How long an outage will last and the 7-day outage risk are estimates. This page compares them with what actually happened and shows how often they held, by kind of outage and by month.

Forecast accuracy

For journalists, developers and other sites

Open data, API and widgets

Open data, API and widgets

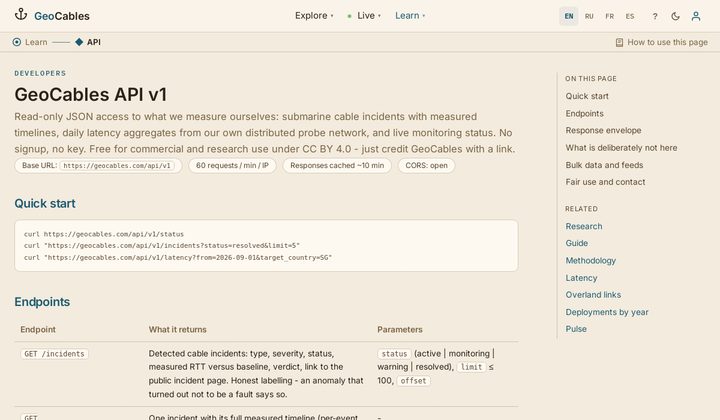
The dataset in CSV and JSON under CC BY 4.0, updated daily; a public API for status, incidents and resilience; embeddable live-status cards for your site; a press page with facts and charts.

API and data

Also: how to use every page in the guide, and how we measure in the methodology. Guide, Methodology.

Log In

Access your routes, favorites, and API key

Create account Forgot password?